


Why we told the story of South Africa’s deadliest storm
Telling the story of Durban’s 2022 floods was not to document disaster, but rather an investigation into what we can learn from that night
Sea level rise: A coastal city like Durban is at risk of a combination of both inland and coastal storm surge flooding during an extreme event, if conditions are right.
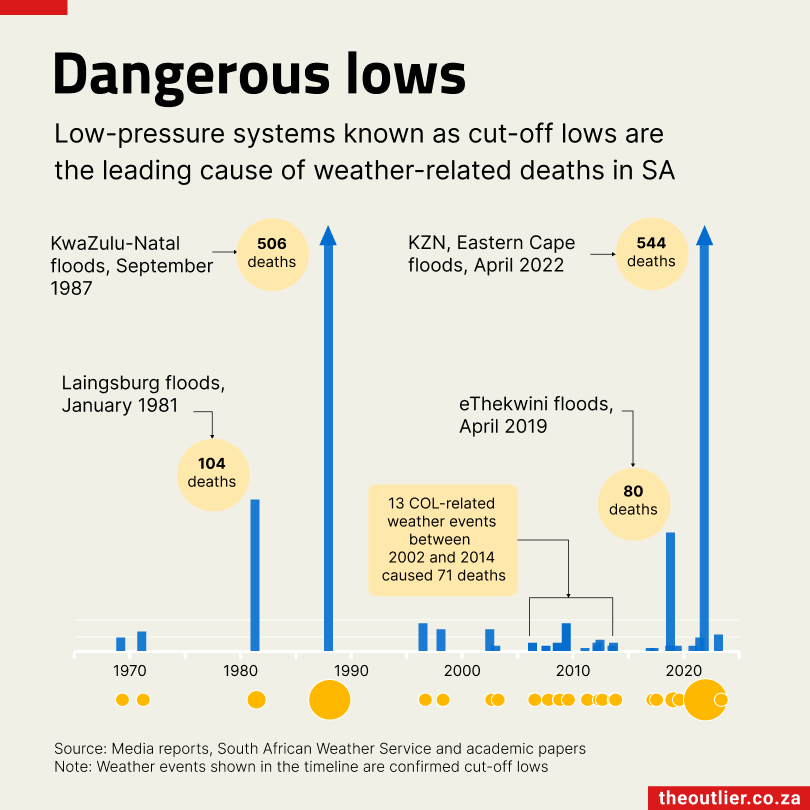
- In April 2022, Durban was hit by a severe storm that caused devastating damage. At least 435 people died, 4,700 people were displaced and 13,500 homes were destroyed
- Wanting to understand what lessons could be learnt that might help mitigate the damage from future climate events, The Outlier team produced A Perfect Storm
- Our investigation combined academic research and interviews with data collection, analysis and visualisation. The project was a joint winner in the features category at the 2023 Sikuvile Journalism Awards
By the time President Cyril Ramaphosa called a state of emergency on April 19 2022, at least 435 people were dead and 54 were missing in the massive storm that slammed the city of Durban. Thousands had lost their homes and businesses. Roads and bridges had been torn away, communications knocked out, sewerage works gutted, and power grids destroyed.
The initial damage was estimated at R17-billion, although the final bill might run even higher than R25-billion.
The devastating climate event – the most catastrophic storm to hit South Africa in recorded history – was well documented by local and international news.
In a reflection on the storm a year later, The Outlier’s team produced A Perfect Storm to look beyond the event itself. We wanted to know what could be done to mitigate some of the damage from future climate events, which will continue to increase as the planet heats up.
Explore
Through a grant from Internews’ Earth Journalism Network, we approached the topic with an eye on solutions from a ‘coastal resilience’ perspective – or the ability of a coastal city to bounce back from climate events.
The project included a deep dive story, including explainers, data analysis and visualisation, as well as a resource guide for African journalists interested in reporting about coastal resilience in their communities. A Perfect Storm was a joint winner in the features category at the 2023 Sikuvile Journalism Awards.
The core project team was made up of Alastair Otter (data visualisation), Laura Grant (data visualisation, analysis and research), Leonie Joubert (reporting, research and writing) and Tanya Pampalone (research, writing, editing and project management). Here’s what we learned from the process.
How did the project begin?
Tanya Pampalone [TP]: Climate change is one of our main interest areas, alongside other development issues, such as education and health. The Earth Journalism Network’s call for proposals for coastal resilience came right when the Durban floods hit. It was a natural fit for us.


Why was it important to tell the climate change story from a solutions-based perspective?
Laura Grant [LG]: The Outlier exists to be an authoritative, accessible and inspiring source of information so people feel empowered to make decisions on the issues that matter in their lives. So we approach stories from the perspective of: ‘How can we give people useful information?’
Using data as a source is an important part of this as is finding solutions rather than just documenting disaster. We don’t want to leave people feeling hopeless.
What was difficult to understand about coastal resilience?
TP: After an initial dive into the reams of available case studies, academic literature, urban planning documents as well as government, nonprofit and civil society analysis, a succinct assessment of the key elements or data points that can measure a city’s coastal resilience aspects was still murky.
That’s partly because every community has a unique set of issues, but also because the Global South presents hurdles that Western scenarios don’t fit very neatly. We used a lot of this background for our resource guide, which we wrote for other journalists reporting on coastal resilience.
Leonie Joubert [LJ]: From a writer’s perspective, the greatest challenge of this project was to lift out the most important messages from a comprehensive but extremely complex body of existing scientific literature relating to climate impacts on Global South cities, wider development challenges, and how to build for better resilience in an ever-more challenging future.

How did the project evolve?
LG: Initially, we wanted to do a more data-driven story, but we struggled to find enough publicly accessible data. We also realised that we ran the risk of creating a textbook. We needed to weave the academic research and data into a narrative that people could relate to.
Durban was a great example because the 2022 flood was not the first the city had experienced, so a lot of research had been done on resilience. Focusing on the Quarry Road community also allowed us to humanise the story and look at potential solutions for the most vulnerable communities.
What was difficult about working with this data?
LG: Finding it. Once you have it, it’s not that difficult to work with. Deciding the best way to present it is often what takes a lot of thought and time. For this project, the geographical data Alastair used to map the median shoreline over a number of years along the eThekwini coast was very complicated. But the people at Digital Earth Africa, who make satellite data for the African continent available, were really helpful.
Why did you focus on Quarry Road as a ‘case study within a case study’?
LJ: For this hybrid story, where the narrative journalism voice blends with explainers, I was fortunate to find an individual whose lives in a community where extensive research had been done and whose experience of the flood event demonstrated the most pressing issues that lower-income communities and cities face.
As a longtime environmental journalist, what surprised you?
LJ: So much information and knowledge about city-scale development issues in the context of climate collapse exists, yet not much of it appears in the media. Most of these city-level development issues don’t shoe-horn into a single beat but cut across them. Journalists need to appreciate where their own beat — politics, economics, metro reporting, health, housing, service delivery — overlap with climate and weather-related issues, and development.
What was challenging about the reporting process?
LJ: South African city personnel have restrictive protocols for dealing with the media. This makes it extremely difficult to get official comment, especially when it relates to issues as complex and technical as those in this story.
Fortunately, many of the city officials we needed to get on record had presented their findings about the Durban floods at public workshops, and the recordings were on the internet. Without access to these, much of the critical information used in the story would not have been available.
The body of scientific literature relating to the subject is vast. The process of sifting through it, lifting out the most important ideas and condensing it took considerably more time and mental heavy-lifting than anticipated.
What tools did you use in data collection, analysis and visualisation?
LG: We used a lot of tools. The most useful for data collection and analysis are Google Sheets and R. For mapping, we used QGIS, Leaflet and Mapshaper the most. For visualisations, we used D3, and sometimes Flourish and Figma.
Notebook
- Explore The Perfect Storm here
- Reporting on Coastal Resilience: A Resource Guide for Journalists
- Read more: The 2022 Durban floods were the most catastrophic yet recorded in KwaZulu-Natal
- Digital Earth Africa
- All the Standard Bank Sikuvile Journalism Awards 2023 winners
- EJN Media Grantee Investigates Coastal Resilience Following South Africa’s Deadly Storm
- This is an edited version of a story first published on medium.com, which was produced with the support of Internews’ Earth Journalism Network