


How we create custom charts using Flourish and Figma
At The Outlier we publish a lot of static graphics and we like to apply our own styles. Here’s how we do it using Flourish and Figma.

There are a lot of data visualisation tools out there, but two of our favourites are Flourish and Figma. Flourish is an online tool for turning data into charts, and Figma makes it easy to edit vector-based graphics.
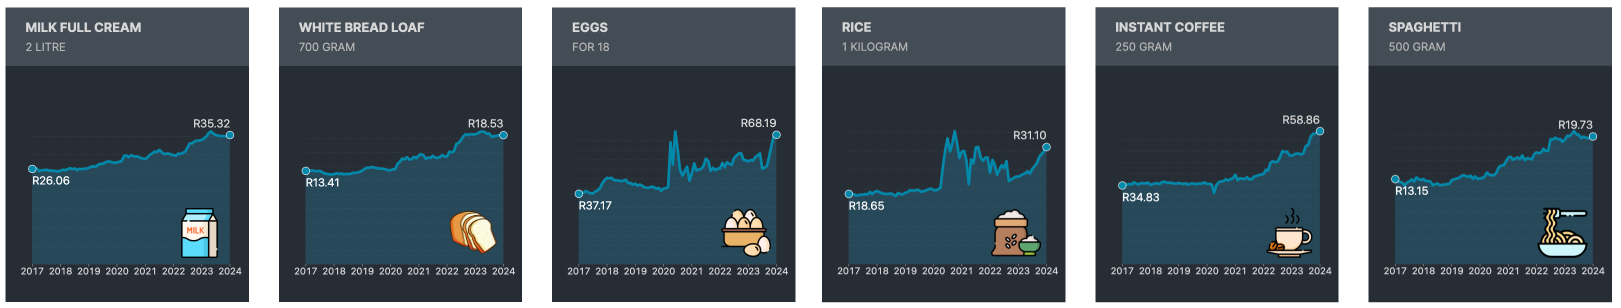
While Flourish makes great interactive graphics, at The Outlier we publish a lot of static graphics and we like to apply our own styles. So it makes sense for us to export static versions of charts from Flourish and then touch them up in Figma. It’s a great combination that helps us produce charts like these.
Following is a step-by-step example of how we do it.
First, data
Before adding your dataset to Flourish you need to know the point you are trying to make. This will influence how you choose to visualise your information.
In our example, we wanted to show the percentage of schools, per province in South Africa, that did not offer grade 12 mathematics classes in 2021.
We could add data in two ways, either by copying-and-pasting it into the Flourish sheet or by uploading a CSV file or Excel sheet. All we did was select the ‘Upload data’ option, choose the file and Flourish did the rest.

You can see below that our ‘Label’ column (Province) was in column A, and our ‘Values’ column (Percentage) was in column B.

The visualisation
Once we’d added our data, we needed to choose a chart type. Flourish offers many different options for visualising data, but for our example, a ‘Column chart’ worked best as we wanted to show each province’s percentage and compare the provinces with one another.

Once we’d selected ‘Column chart’ from the right-hand panel, the bars appeared in the same order as they appeared on our Flourish datasheet.
It’s always a good idea to have your data in either ascending or descending order as opposed to a random arrangement; this makes any outliers much more obvious to the reader. To do this, under ‘Sort mode’, select ‘Value’. This option will put your data in ascending order. You can also sort your data in alphabetical order, according to the label name.


You’ll notice that the percentage sign does not appear on the bars, despite it appearing in the datasheet. To fix this, select the ‘Number and date formatting’ dropdown menu. In the ‘Suffix’ box, enter a percentage sign. You can also add a prefix if, for example, you are working with a currency, and you can change the number of decimal points.

Next, select whether you want a legend to appear above the chart. We removed the legend in our example because we were only working with one year of data and we planned to give more information about the data in our heading, which we applied later in Figma. We also didn’t need to add a title or change the column colours because we knew we’d do this later in Figma as well.

Now it was time to download the chart as an SVG that we could edit later. We clicked on ‘Export & publish’ in the top right of the Flourish window, clicked ‘Download image’ and selected SVG format.


Customising your chart in Figma
To customise your graphic in Figma, first add a frame. Figma has a list of pre-designed frames that work for Twitter, Instagram, Facebook and different device platforms like laptops, smartphones and tablets. You can also manually adjust the width and height of your frame.

Once you have your frame, think about the following elements:
- Does your graphic need a heading and subheading?
- Are there any other elements you want to add to your graphic?
- Don’t forget to add a source and a line or logo for who made the graphic.
Now make sure your ruler is enabled. This will help with spacing and aligning your elements. To do this, choose the Figma logo in the top left-hand corner and select ‘View’ and then ‘Rulers’. Click on either the vertical or horizontal ruler and drag it into place on your frame to create a margin. Or, if you prefer to design using a grid, on the right-hand side of your page under ‘Layout’, you will find the option of a ‘Layout grid’.

Now add your elements.
Select the text tool at the top of your page, represented by ‘T’, draw a text box and add a heading. Repeat this process with your subheading as well as your source note at the bottom of the graphic. To customise your text, use the text styles found in the panel on the right side of your screen.
Remember, your font size needs to be readable! Don’t choose a size that is so small your reader needs to zoom in on their phone or laptop to see it.

Now add the graphic. Select the ‘Shape’ tool, represented by a square icon at the top of your page. Then choose ‘Place image’ from the dropdown menu and upload your SVG graph from Flourish.
By holding down the shift key, you can keep the dimensions of the graph as you make it bigger or smaller. You can repeat the same process to add a logo to your chart, too.

Finishing touches
On the left side of your screen, you will see all the elements of the graphic including the original frame that holds all the elements: the text for your heading, subheading and source note, and a frame for your Flourish graph.
In our example, we wanted to change the colour of our graph. To do this, we selected the subset frame ‘Flourish graph’ by clicking on the hashtag symbol. This opened up additional elements connected to this graph; in our case ‘data-points’ (our vertical bar chart) and ‘Group’, a collection of the words and numbers used on our Flourish graph’s x and y axis. We chose to do a bulk edit by selecting ‘data-points’ and changing the colour of our bar chart.

It is a little tricky to edit the font and font size in the graphic. To do this, you have to individually select the numbers or axis labels and change the font. But be careful. Your labels might disappear or be cut short. This means the frame holding your Flourish graph is too small.
What we often do is reorder the text by selecting the elements and dragging them to the top so they are no longer in the Flourish graph frame, but only in the original frame.

Once it is ready, we exported the graph as a PNG or JPEG by selecting the entire frame and choosing ‘Export’ from the righthand column.

Voila!

Notebook
- For more on how to create a chart using Flourish, watch this tutorial on their YouTube Channel
- Visit The Outlier’s chart gallery
- Learn with The Outlier Learning. Find out more about our training courses here
- Subscribe to The Outlier for data-driven insights
- Sign up to the DataBites newsletter for more tips, tech and data storytelling techniques