


Matric exam data can help uncover the state of education
Outlier Insights is a new project that makes it easy to view and interrogate datasets – such as 13 years of South African matric results.
Photo: Ashraf Hendricks/GroundUp
At the start of each year, South Africa’s attention is focused on how the previous year’s grade 12 cohort fared in their final exams, with the pass rate presented as a barometer of the health of the South African education system. But it is just one metric.
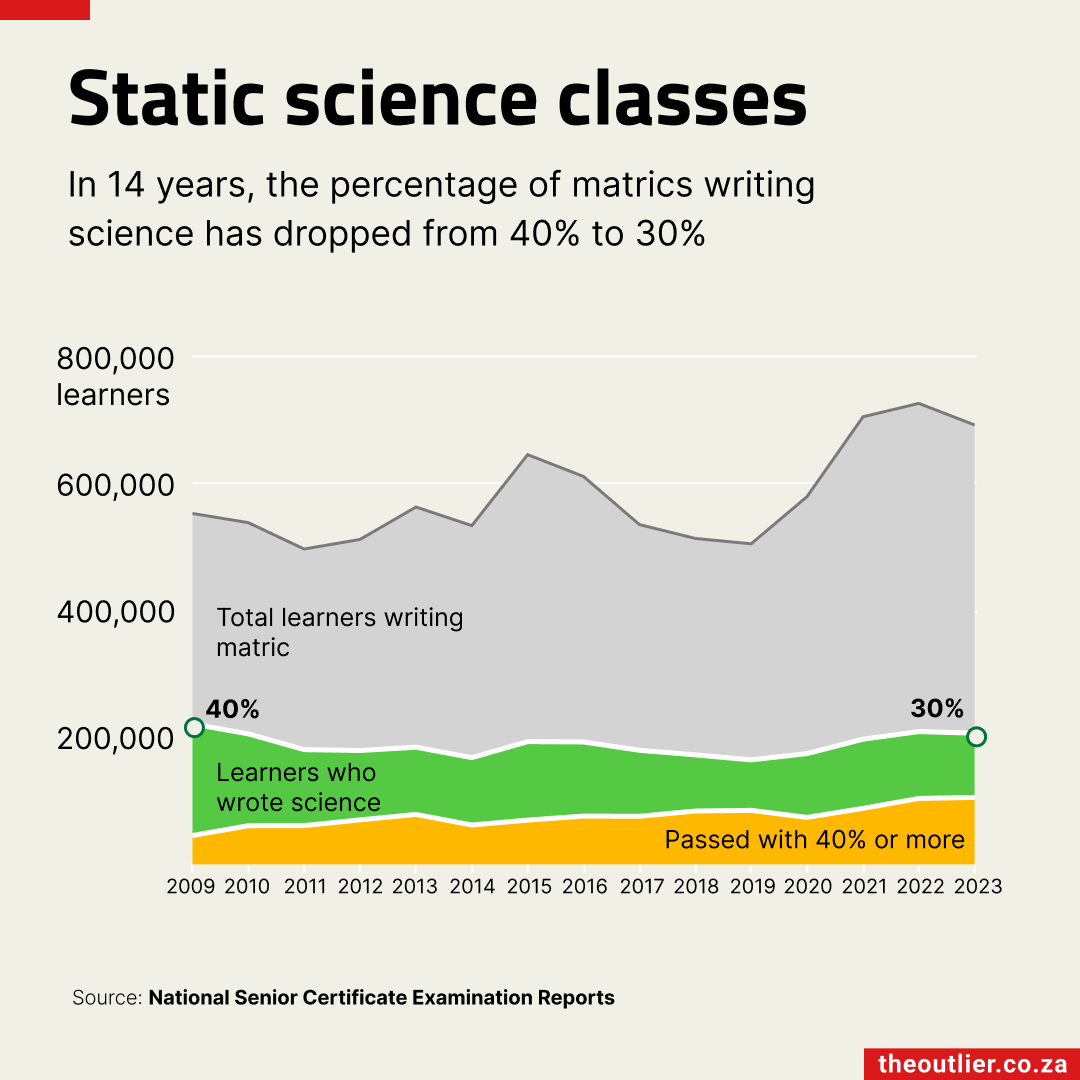
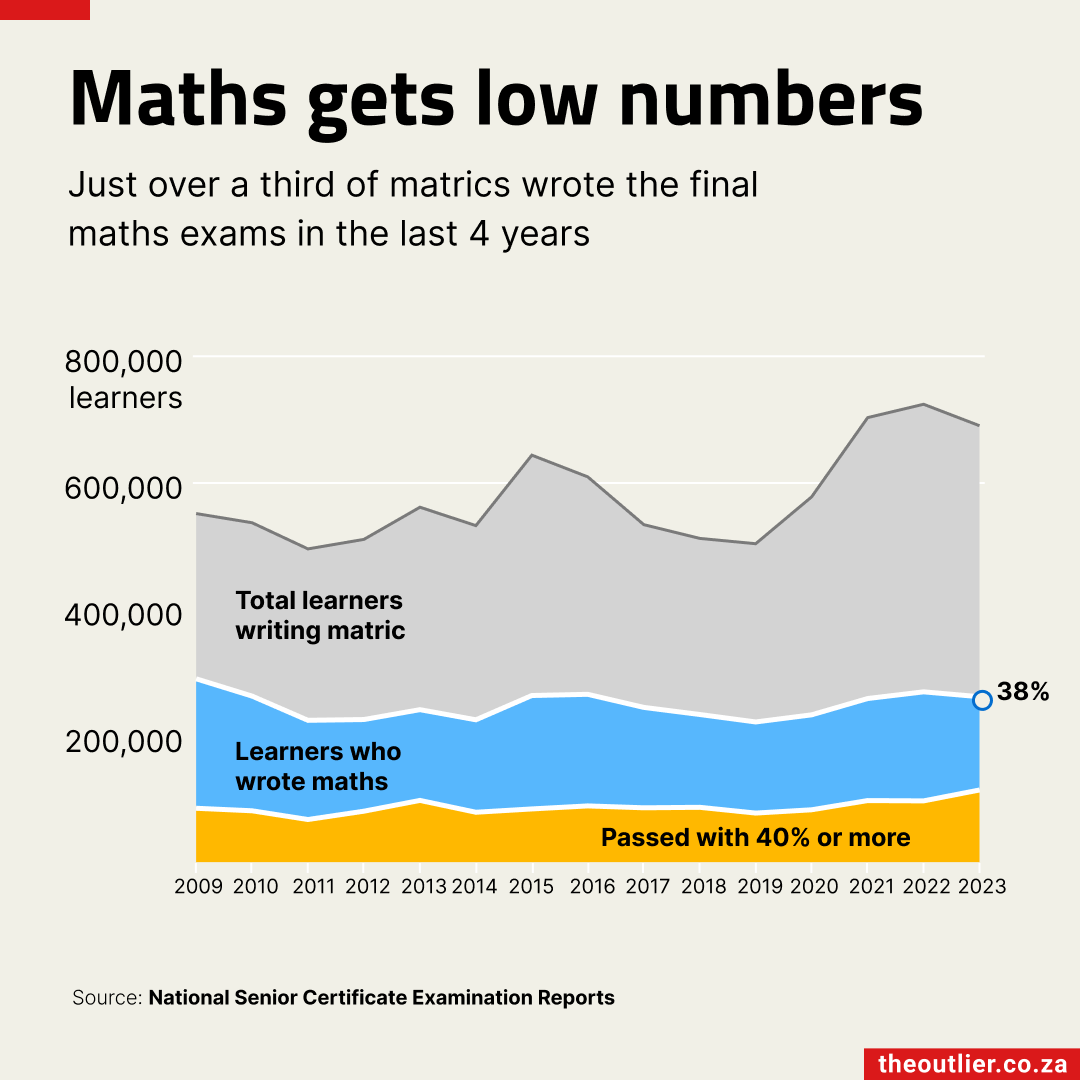
How well matrics pass maths and science, for example, and what percentage pass those two key subjects with at least 40% are other measures that are becoming increasingly important as South Africa navigates the dynamic space of artificial intelligence and emerging technologies.
The Outlier has trawled through 13 years of reports issued by the Department of Education to track the performance of learners completing the National Senior Certificate exams. The historical data provides context, reveals trends and facilitates evidence-based analysis.

Data tools
With Outlier Insights, you can:
- Compare past performance over time. Is the pass rate getting better or worse? Our information dates back to 2009
- Compare performance across provinces. Which is the best-performing province? The most-improved province?
- Calculate progress in the key subjects of maths and science. How many learners are passing with at least 30% or 40%?
- Download and republish (free) graphics to illustrate your story – data visualisations, charts or graphs
Scroll down for instructions on how to use Outlier Insights.
In charts
There are various education-related charts from previous years in the Our World in Charts archive. Subjects covered include the performance of no-fee schools and the number of bachelor passes achieved.
Telling stories
Education is a primary focus for The Outlier. Past stories about the country’s matric results include:
- No-fee schools are at a real disadvantage when it comes to maths
- Fourth Industrial Revolution seems far away for schools where no matrics write maths or science
- Matric maths and science numbers remain dismally low
- No-fee paying schools maintain their bachelor pass rate, despite Covid-19
- Matrics in 2021 buck school drop-out trends
Read more education stories here
What is a matric pass?
According to the Department of Basic Education, the following are minimum pass requirements for National Senior Certificate candidates
Bachelor studies
- At least 40% for the candidate’s home language (compulsory)
- At least 50% for 4 other subjects, excluding life orientation
- At least 30% for the language of learning and teaching of the higher education institution
- At least 30% for 1 other subject
- Must pass at least 6 of the 7 subjects
Diploma studies
- At least 40% for the candidate’s home language (compulsory)
- At least 40% for 3 other subjects, excluding life orientation
- At least 30% for the language of learning and teaching of the higher education institution
- At least 30% for 1 other subject
- Must pass at least 6 of the 7 subjects
Higher certificate studies
- At least 40% for the candidate’s home language (compulsory)
- At least 30% for the language of learning and teaching of the higher education institution
- At least 40% for 2 other subjects
- At least 30% for 3 other subjects
- Must pass at least 6 of the 7 subjects
How to use Outlier Insights
All data and charts are free to view, download and republish.
- Go to insights.theoutlier.co.za. You will be asked to register by entering your email address

2. Hover over ‘Education’ in the red bar and, from the dropdown, select the graph you would like to view
3. You can view and download the chart as a column chart instead of a line chart. Toggle by using the ‘graph’ button on the bottom right
4. To download a chart for republication, select the appropriate PNG button5. You can download the data for further analysis as .csv files. These can be opened in Google Sheets
Notebook
Please credit Outlier Insights on any of the data or charts you use. Cite the education charts like this: National Senior Certificate Examination Reports via Outlier Insights [Right-click on this link to copy it]