

Our World in Charts is a unique collection of hundreds of charts published by The Outlier. The charts cover key issues both in South Africa and around the world on topics such as education, economy, politics, sport and more. Republish our charts for free.
- Cape Town has experienced one of the wettest Junes since 1990
- The heavy rains were mainly caused by a higher-than-average frequency of cold fronts
- Severe rainfall events are likely to become more common; but floods are not unusual in Cape Town, and they have become more damaging because of the increase in the population.
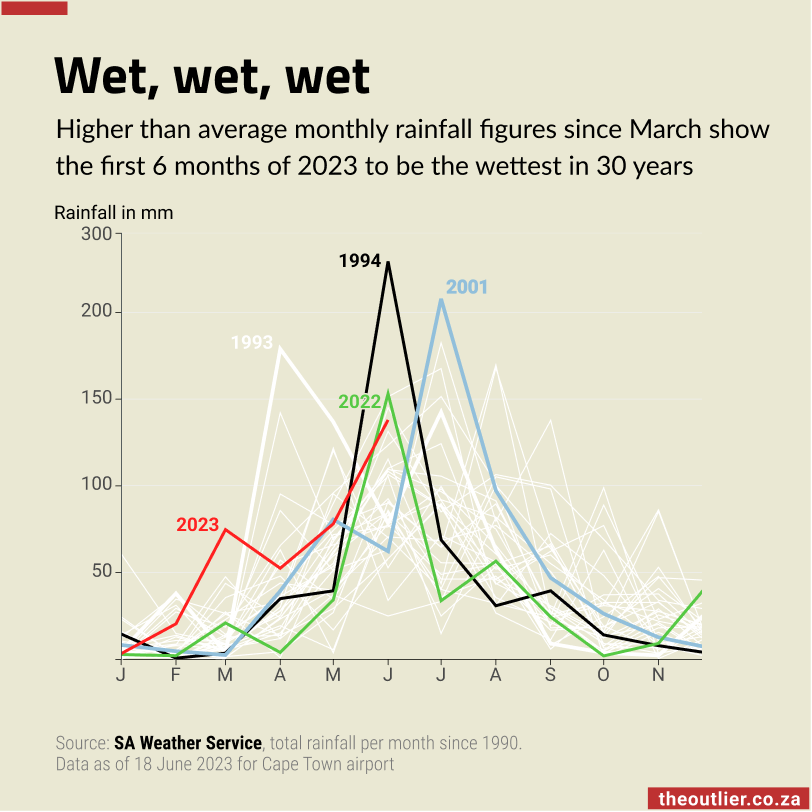
Cape Town gets most its of rain in the winter months – June, July and August – but after higher than average rainfall since March, more rain fell in the first six months of 2023 than in the whole of 2017. The impacts of high rainfall events like those that occurred in June have been getting worse as more people build homes in high-risk areas. A city official said that between 2020 and 2021, 189 informal settlements were created in Cape Town and 60% of them are considered high risk.
— 29 June, 2023Subscribe to the weekly newsletter for more charts like this