
Our World in Charts is a unique collection of hundreds of charts published by The Outlier. The charts cover key issues both in South Africa and around the world on topics such as education, economy, politics, sport and more. Republish our charts for free.
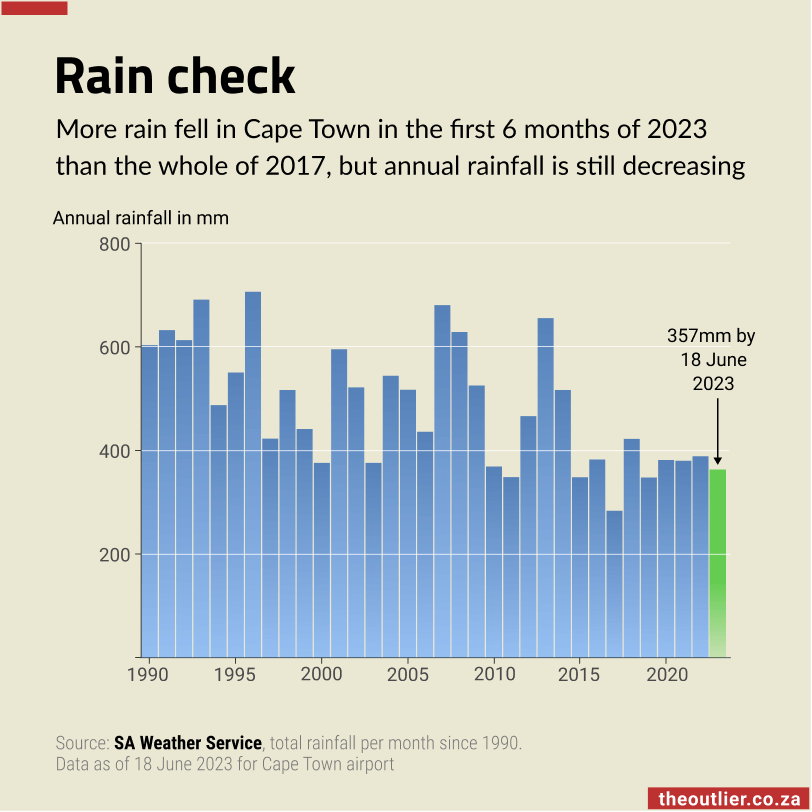
- For the past two years, Cape Town has had very wet Junes but overall the city is actually getting drier
- This has been confirmed by historical records and SA Weather Service rainfall measurements
- So far this year looks as though it will have the most rain since 2015
The latest United Nations Intergovernmental Panel on Climate Change report confirmed by historical drying trend over especially the extreme western parts of South Africa, said Dr Andries Kruger, the chief climate scientist from the South African Weather Service.
‘On the other hand, with a warming atmosphere, the air can hold more moisture [water vapour]. Therefore short-term rainfall episodes are likely to become more extreme, with a probability of higher 24-hour rainfall amounts,’ he said.
— 3 July, 2023Subscribe to the weekly newsletter for more charts like this