

Our World in Charts is a unique collection of hundreds of charts published by The Outlier. The charts cover key issues both in South Africa and around the world on topics such as education, economy, politics, sport and more. Republish our charts for free.
- Joburg Water said there were an average of 4 water pipe bursts per kilometre in Johannesburg last year
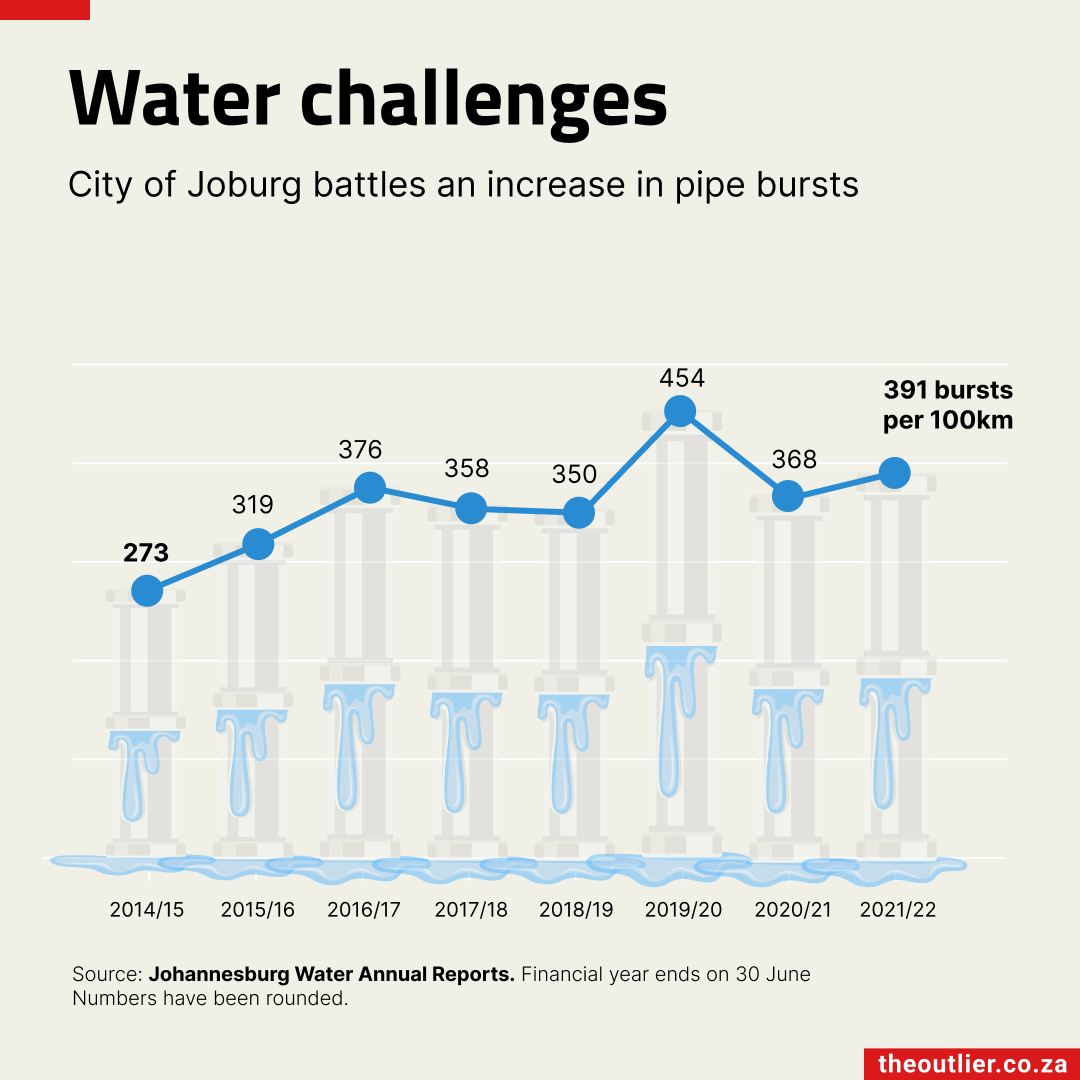
- This is 40% higher than the number of bursts in 2015
- The city is replacing around 1% of its ageing 12,364km water pipe network each year
Joburg has a water infrastructure problem. Between 2015 and 2022, burst pipes increased from 273 per 100km to 391 per 100km or about 4 holes in every 1km pipe.
Joburg Water said in its 2022 annual report that it lost water worth R1.5-billion to leaks, an increase of R621-million from the R878.4-million lost to leaks in 2018.
Joburg Water says the pipe bursts occur when water fluctuations lead to air pockets, and too much pressure of water hitting an air pocket results in a pipe breaking. It is exacerbated by old infrastructure.
In 2022, Joburg Water replaced 100km of its 12,364km water pipe network.
— 15 November, 2023Subscribe to the weekly newsletter for more charts like this