

Our World in Charts is a unique collection of hundreds of charts published by The Outlier. The charts cover key issues both in South Africa and around the world on topics such as education, economy, politics, sport and more. Republish our charts for free.
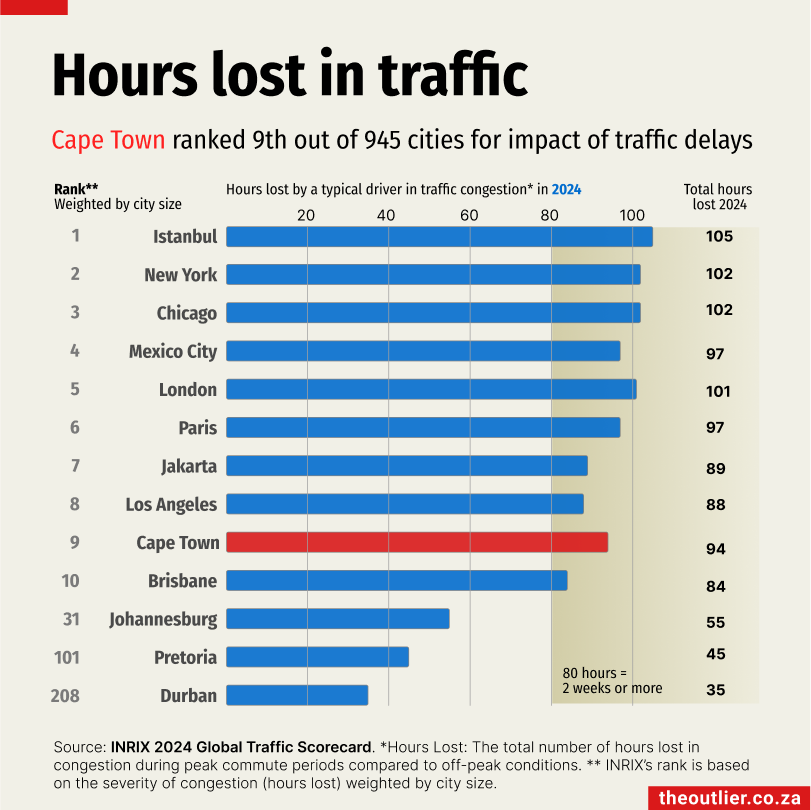
Cape Town was ranked ninth for traffic congestion out of more than 945 cities in the world in 2024. A typical driver lost 94 hours sitting in traffic, according to INRIX, a company that provides mobility data, in its 2024 Traffic Scorecard. That’s over two weeks lost just sitting in traffic.
Cape Town’s congestion appears to be worse than it was in 2023, when a typical driver lost 83 hours, according to INRIX’s calculations. Johannesburg ranks 31st on the INRIX scale, with drivers losing 55 hours to traffic congestion in 2024.
INRIX describes the total time lost as “the difference between driving during commute hours versus driving at night with little traffic”. Cities are ranked based on the severity of congestion (hours lost) weighted by city size.
Unfortunately, the 2024 Traffic Scorecard doesn’t include any African urban centres outside of South Africa, which is a pity because it would be interesting to see how Lagos, Nairobi and even Harare compare to Cape Town.
Istanbul was ranked as the city most-impacted by congestion in 2024, with 105 hours lost.
— 8 January, 2025Subscribe to the weekly newsletter for more charts like this