
Our World in Charts is a unique collection of hundreds of charts published by The Outlier. The charts cover key issues both in South Africa and around the world on topics such as education, economy, politics, sport and more. Republish our charts for free.
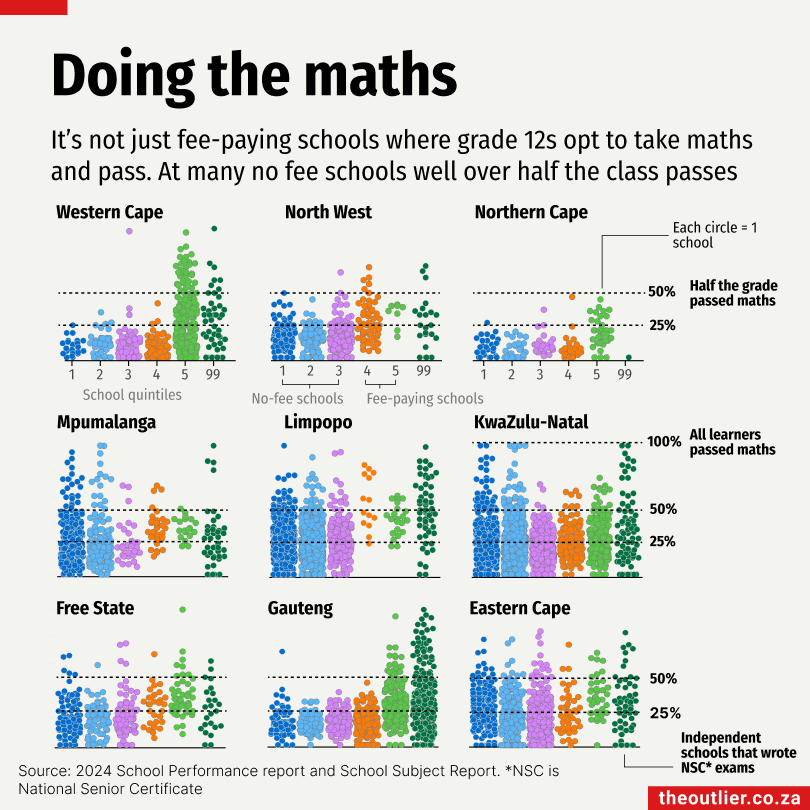
Maths is not a popular subject choice at South African schools. By grade 12, only about one in three learners write the maths exams.
Although maths literacy, which is based on number skills, is a more common choice, those who hope to study science, technology or engineering must do core maths.
Schools in SA are divided into five quintiles: quintiles 1 to 3 are generally poorer schools and quintiles 4 and 5 are in better-off areas.
You’d expect learners in wealthier schools to be more likely to pass maths as they have access to better resources. But data from the department of basic education shows that at least a quarter of the grade 12s at many quintile 1, 2 and 3 schools passed maths in 2024.
In the chart, each dot represents a school and its position on the y-axis represents the proportion of learners who passed the final maths exams with 30% or more.
— 19 January, 2025Subscribe to the weekly newsletter for more charts like this