Want a clear view?
Log in / Register *
to continue reading this article
* Registration is free and gives you access to recent Outlier articles. Subscribers get access to all articles, charts, tools and data. See all membership benefits below. NOTE When you register you will be added to our twice-weekly newsletter list. You can unsubscribe at any time. 
Having trouble logging in? Try these suggestions
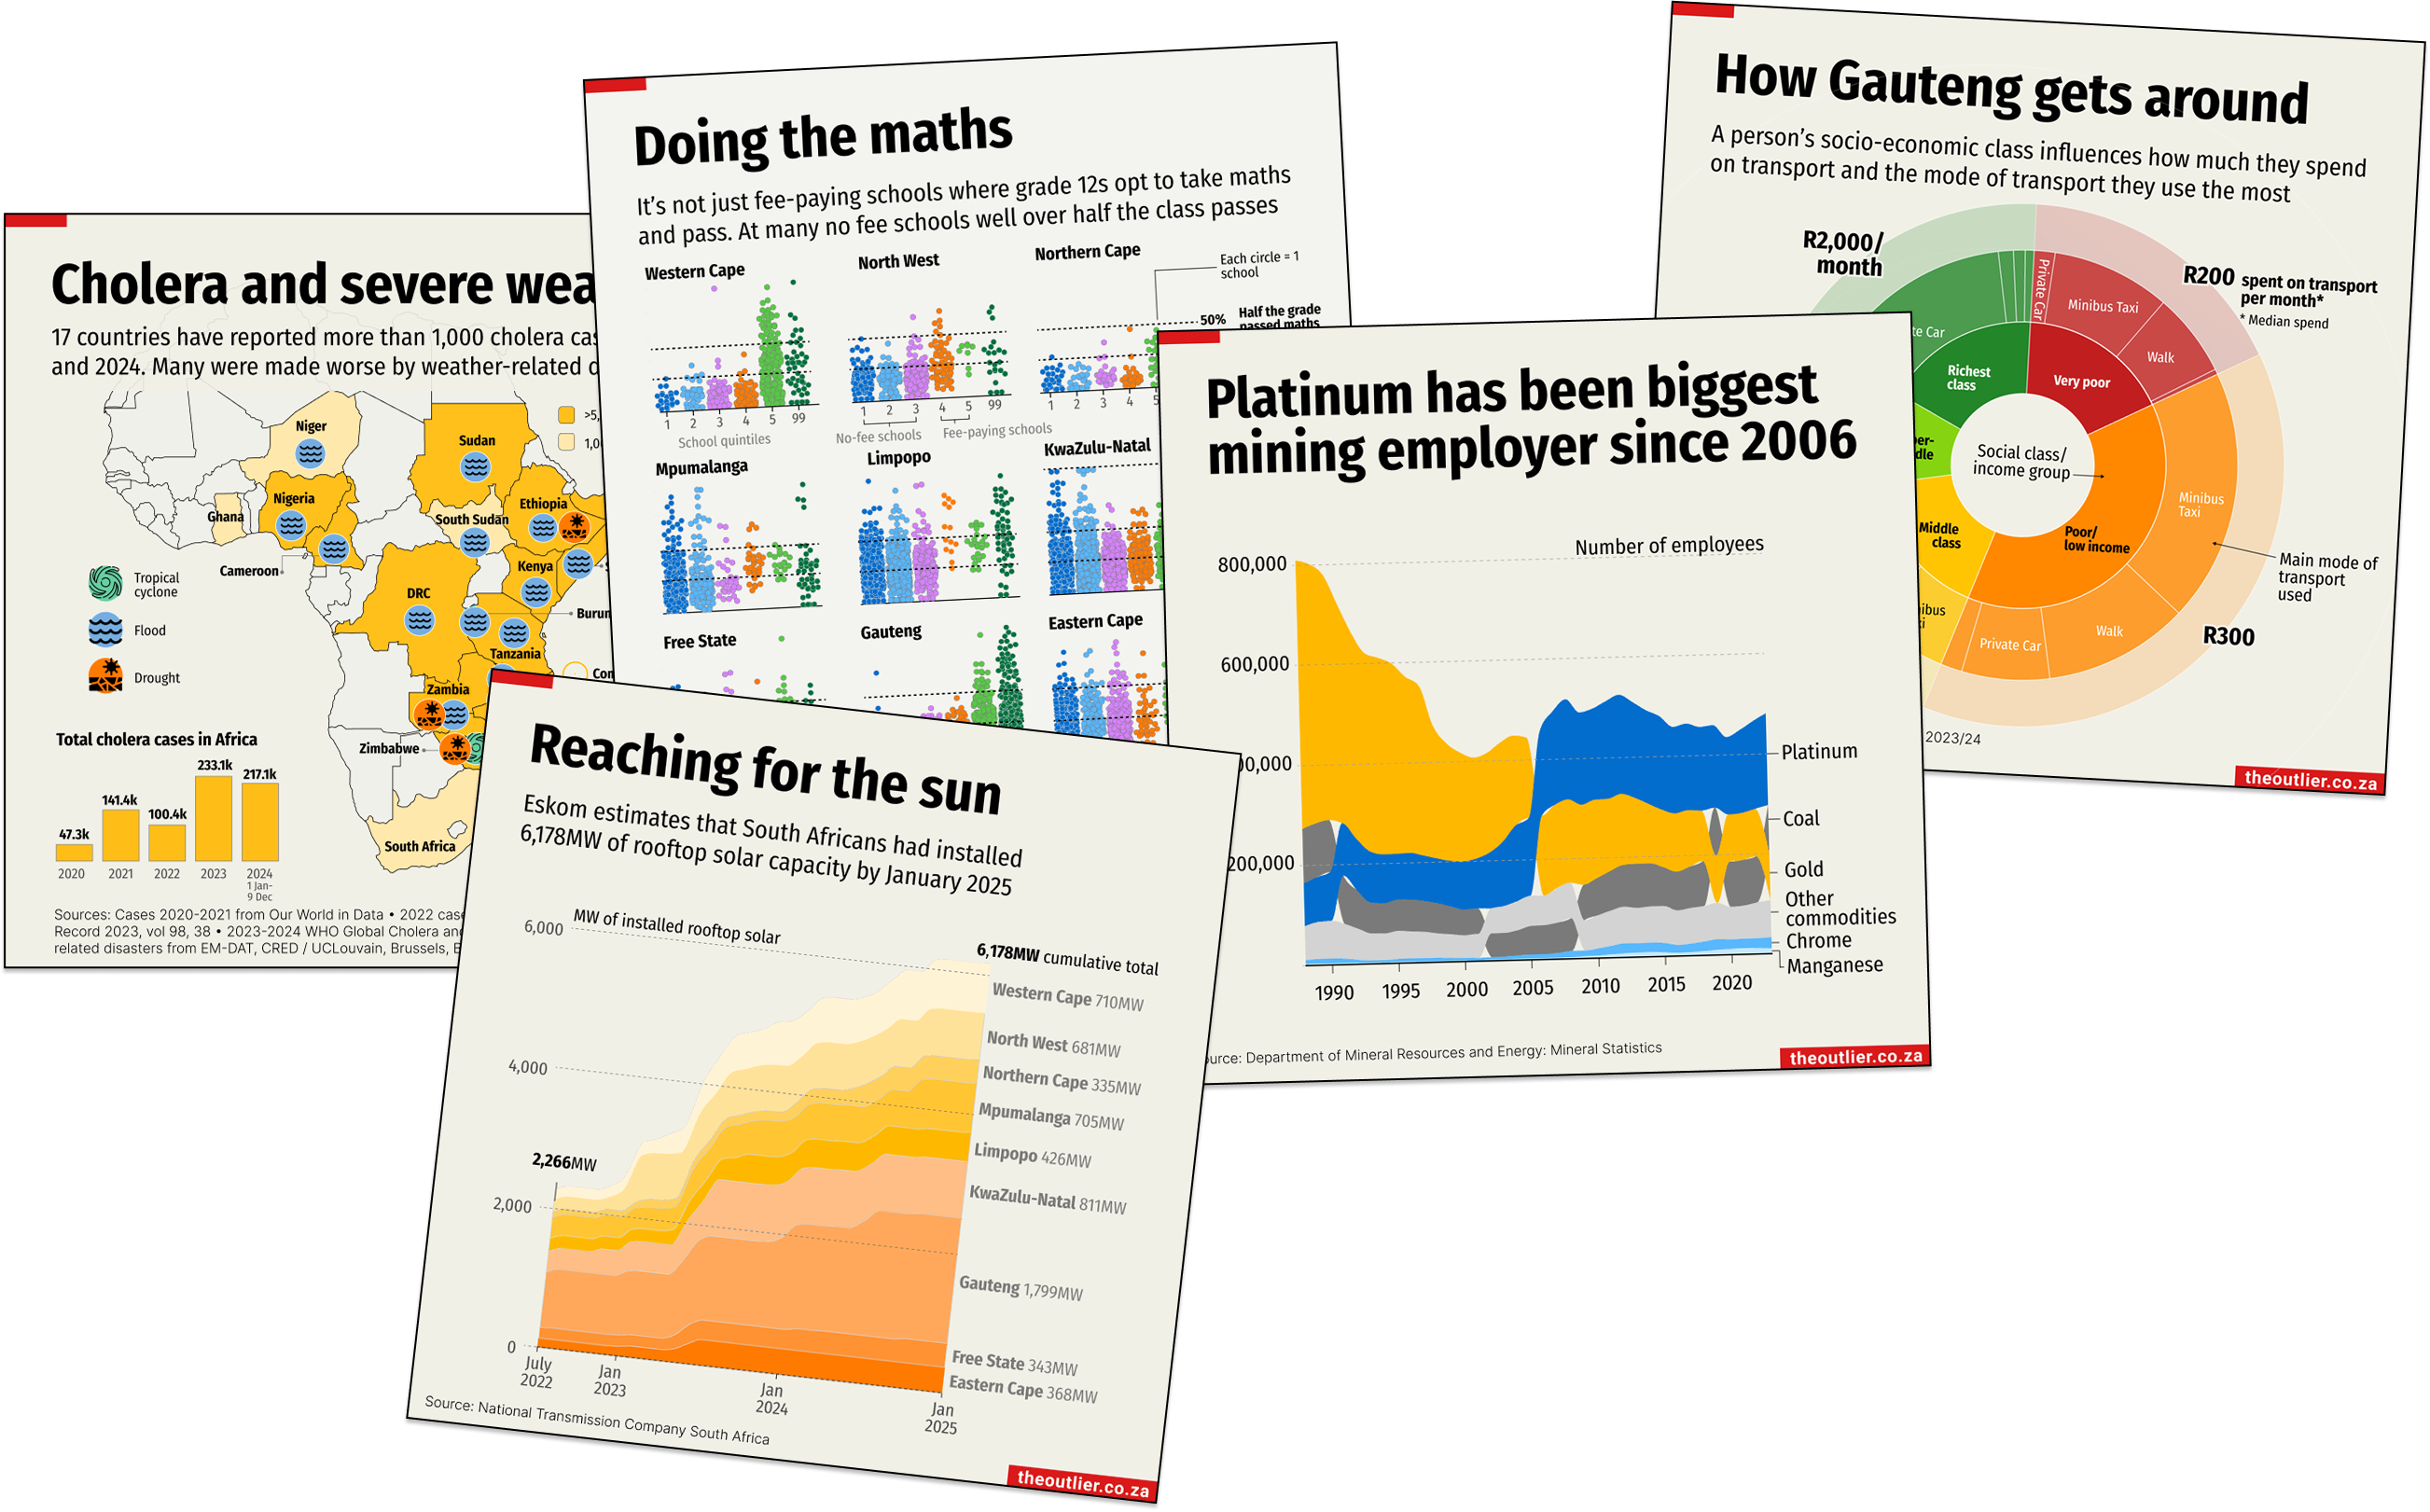
The Outlier tells stories differently
We tell stories but with data. We've made literally hundreds of charts (more than 700 and counting) and we've made dozens of data-based tools that you can use to make a little more sense of the world around you.