


Unrest in SA: Joblessness and rising prices make a volatile mixture
Unemployment in South Africa is among the worst in the world and unemployment among the youth is particularly high, but that doesn’t tell the full story.
People queue for social grants outside the Sassa office in Eerste River. Photo: Ashraf Hendricks/GroundUp
Over the week of 10 to 16 July South Africa saw outbreaks of unprecedented violence and looting. Originating in KwaZulu-Natal and later spreading to Gauteng, with smaller outbreaks in other parts of the country later the in the week, the violence was ostensibly a response to the jailing of former president Jacob Zuma for contempt of court, but as the looting spread it became increasingly clear that, while there were likely sinister forces at play behind the scenes, the violence was about more than frustration with a single court ruling, but it was rather an expression of anger and frustration felt by thousands of South Africans. And as the destruction spread there was an inevitable increase in opportunism.
The causes and results of this week of violence will be analysed extensively over the coming months. Factors that are likely to be highlighted will be the situation of the youth population and poverty in general. We look at data on unemployment, social grants and the rising cost of food to see what they show us about the state of South Africa.
Unemployment
Unemployment in South Africa is among the worst in the world and unemployment among the youth is particularly high. In its most recent statistics release Stats SA reported that unemployment had reached a new peak of 32.6%.
However, the 32.6% figure doesn’t tell a complete story. That is the number of South Africans of working age that are officially unemployed. The number of people officially employed is 38%. The remaining 29.5% of people are considered to be either “discouraged job seekers” or “not economically active”. If these two categories of people without jobs are combined with the unemployed the number of people without some form of job is around 62%.
In the case of younger South Africans this is often much more extreme. According to Stats SA’s Labour Force Q1 2021 report, 27% of South Africans in the 20-to-34-year-old age group are officially unemployed. However, if you include the discouraged job seekers and those considered to be “not economically active” the number of 20-34 year-olds without paid employment is 68%. If you break that down by province more than 70% of the youth are without a job in five of South Africa’s nine provinces (Eastern Cape, Limpopo, Free State, KwaZulu-Natal and North West).
The grouping of people defined as “not economically active” are those between the ages and 15 and 65 who are not available for work, including full-time scholars and students, homemakers and those who are unable or unwilling to work.

Splitting out the work status of the 20-to-34-year-olds in the country additional patterns become obvious. The majority of people in the Eastern Cape and Western Cape without work are categorised as either unemployed or not economically active while a relatively high percentage of people in North West, KwaZulu-Natal, Limpopo and Mpumalanga are in the discouraged job seekers category.

Social Grants
Alongside the increase in the number of people without jobs, the number of people receiving a social grant has been steadily increasing over the past 10 years. In 2020/21 3 million more people received a social grant than did in 2011/12, increasing from 15.3 million to 18.6 million during this time. These include old age and child support grants as well as those for military veterans and foster children. Social grants range from R460 to around R1,890 a month.

The cost of feeding a family
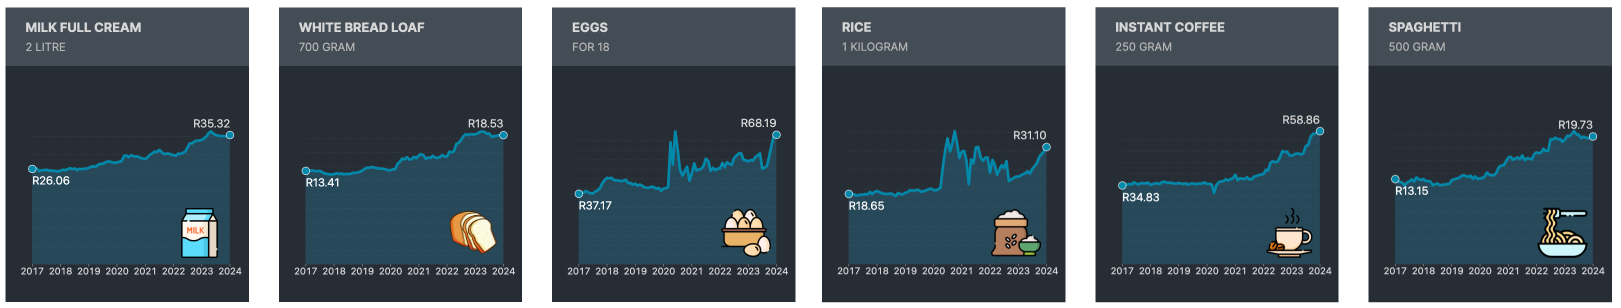
For many South Africans it is also becoming increasingly difficult to feed their families. In April 2020 the cost of a household food basket – 44 items typically bought by a low-income family of seven – exceeded the national minimum wage for the first time according to Pietermaritzburg Economic Justice & Dignity (PMEJD), which has been tracking food costs since mid-2018.
In March 2021 the national minimum wage was increased to R21,69/hour. At this rate a worker working 8 hours a day for 20 days a month would earn R3,470 a month. In June 2021 the cost of a household basket cost R4,128.

PMEJD data also provides some insight into the changes in food prices by providing a comparison between the “core” products bought by families between September 2020 and June 2021. The core product basket includes those products that families consider essential. Over this time period the core product price has increased by 8.4%, though individual foods such as sugar beans and cooking oil have increased by 43% and 29% respectively.
table.tableizer-table { font-size: 14px; border: 1px solid #CCC; font-family: ‘Roboto Condensed’, Arial, Helvetica, sans-serif; border-collapse: collapse; width: 100%; max-width: 700px; } .tableizer-table td { padding: 4px; margin: 3px; border: 1px solid lightgray; padding: 3px 7px; background: #f9f9f9; } .tableizer-table th { background-color: #31769E; color: #FFF; font-weight: bold; padding: 7px; } .subtotal { font-weight: 700; background: } .number { text-align: right;} td + td { text-align: right; } td:nth-child(2):before { content: ‘R ‘ } td:nth-child(3):before { content: ‘R ‘ }| Product | Sept 2020 | June 2021 | % Change |
|---|---|---|---|
| Maize meal (30kg) | 212.68 | 241.4 | 13.50% |
| Rice (10kg) | 135.99 | 137.65 | 1.22% |
| Cake Flour (10kg) | 92.45 | 93.69 | 1.34% |
| White sugar (10kg) | 151.8 | 163.23 | 7.53% |
| Sugar beans (5kg) | 116.77 | 167.77 | 43.68% |
| Samp (5kg) | 42.52 | 46.72 | 9.88% |
| Cooking oil (5L) | 104.43 | 135.74 | 29.98% |
| Salt (1kg) | 12.27 | 12.99 | 5.87% |
| Potatoes (10kg) | 67.2 | 67.77 | 0.85% |
| Onions (10kg) | 70.07 | 73.84 | 5.38% |
| Frozen chicken pieces (10kg ) | 314.61 | 336.51 | 6.96% |
| Curry powder (200g) | 30.25 | 30.69 | 1.45% |
| Stock cubes (24 cubes x2) | 37.87 | 37.38 | -1.29% |
| Soup (400g x2 ) | 37.47 | 39.23 | 4.70% |
| Tea (250g ) | 23.12 | 22.76 | -1.56% |
| White bread (25 loaves) | 321.69 | 332.94 | 3.50% |
| Brown bread (25 loaves) | 294.52 | 299.85 | 1.81% |
| Subtotal of core foods | 2,065.71 | 2,240.15 | 8.44% |

Before the national minimum wage was introduced in January 2019 researchers at the Development Policy Research Unit at the University of Cape Town estimated that “nearly half of all employees (46%), or 5.2 million workers, earned hourly wages below the minimum wage“. For these people, even if their pay is now in line with the minimum wage, it’s still a struggle to make ends meet. It’s even harder for the people surviving on social grants and for those with no regular income and very little hope of finding a job.
One in four South Africans (25%) live below the food poverty line, which was calculated last year by StatsSA at R585 per person per month as the amount of money needed to afford the minimum required daily energy intake. Add to that the effects of a year and a half of coronavirus pandemic restrictions and it’s little wonder people are frustrated and angry.