
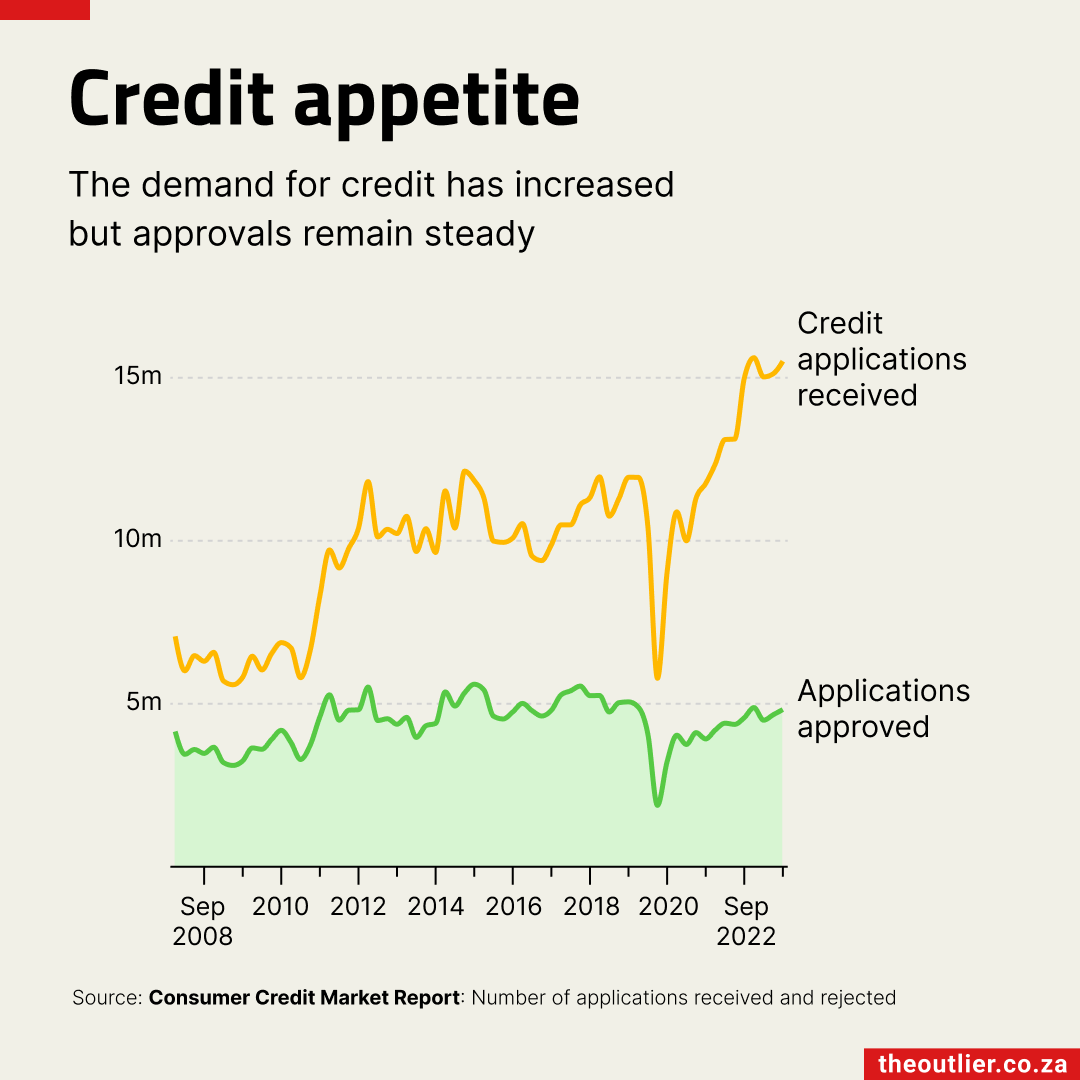
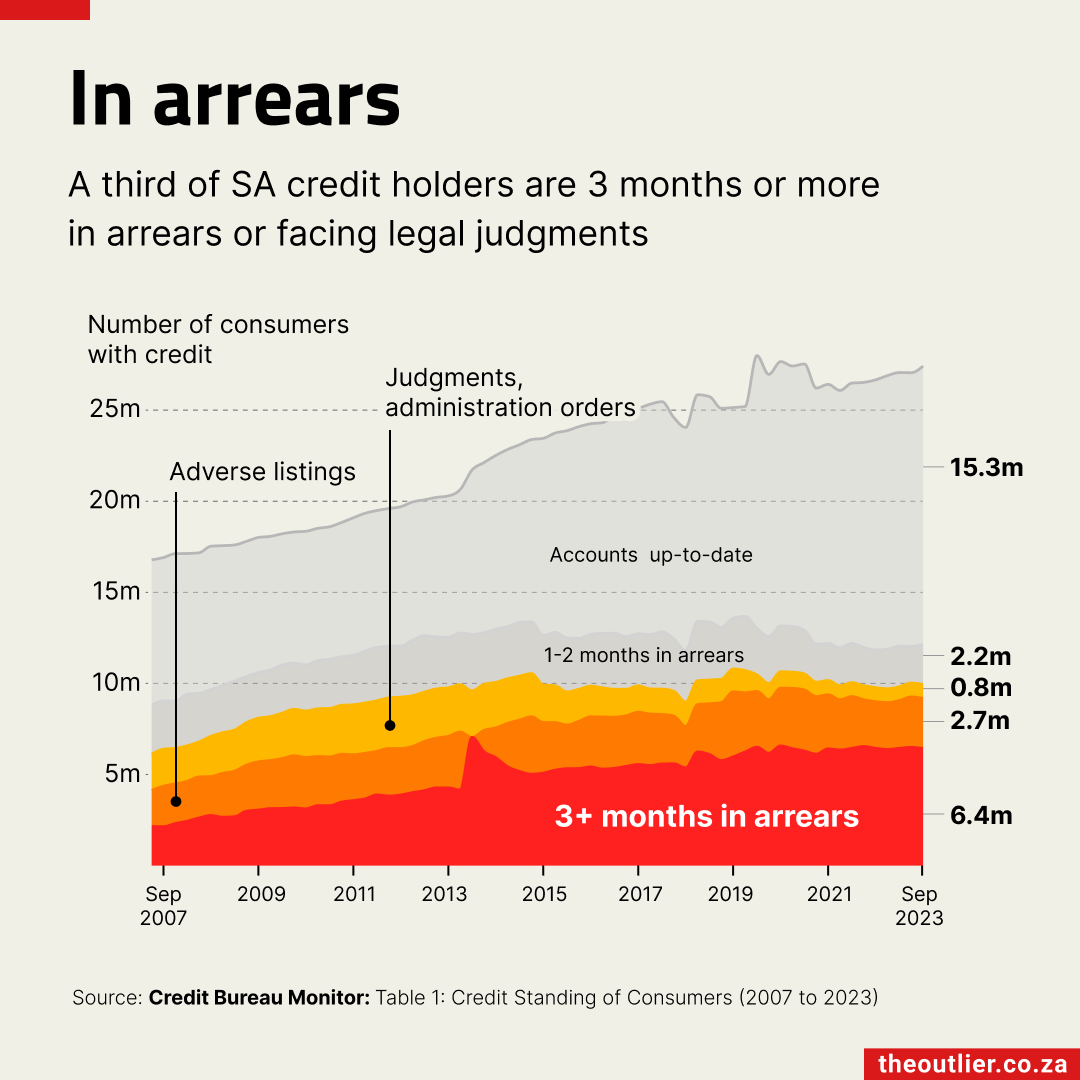


Although at least 10-million South Africans are at least three months behind on their repayments, the appetite for credit remains high.
Two decades ago, two of South Africa’s biggest retailers were almost on a par. We take a look at the metrics to see what has changed since then.
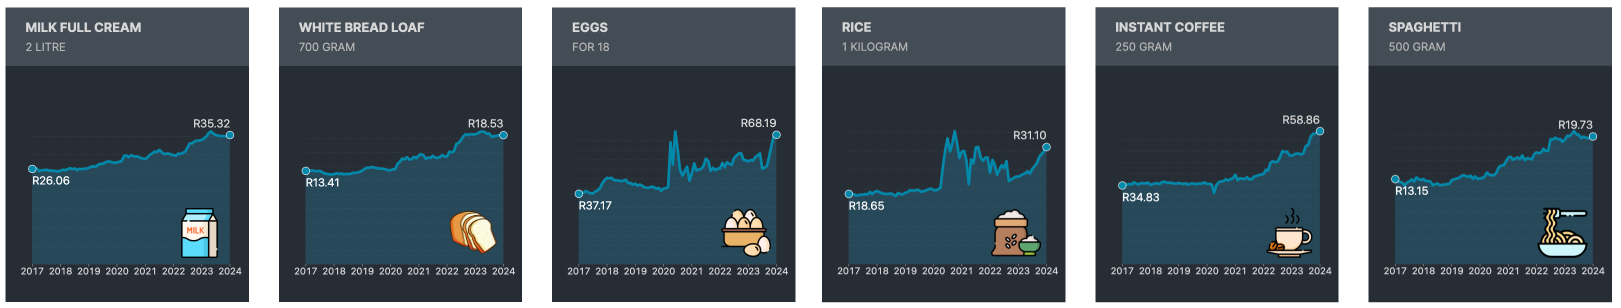
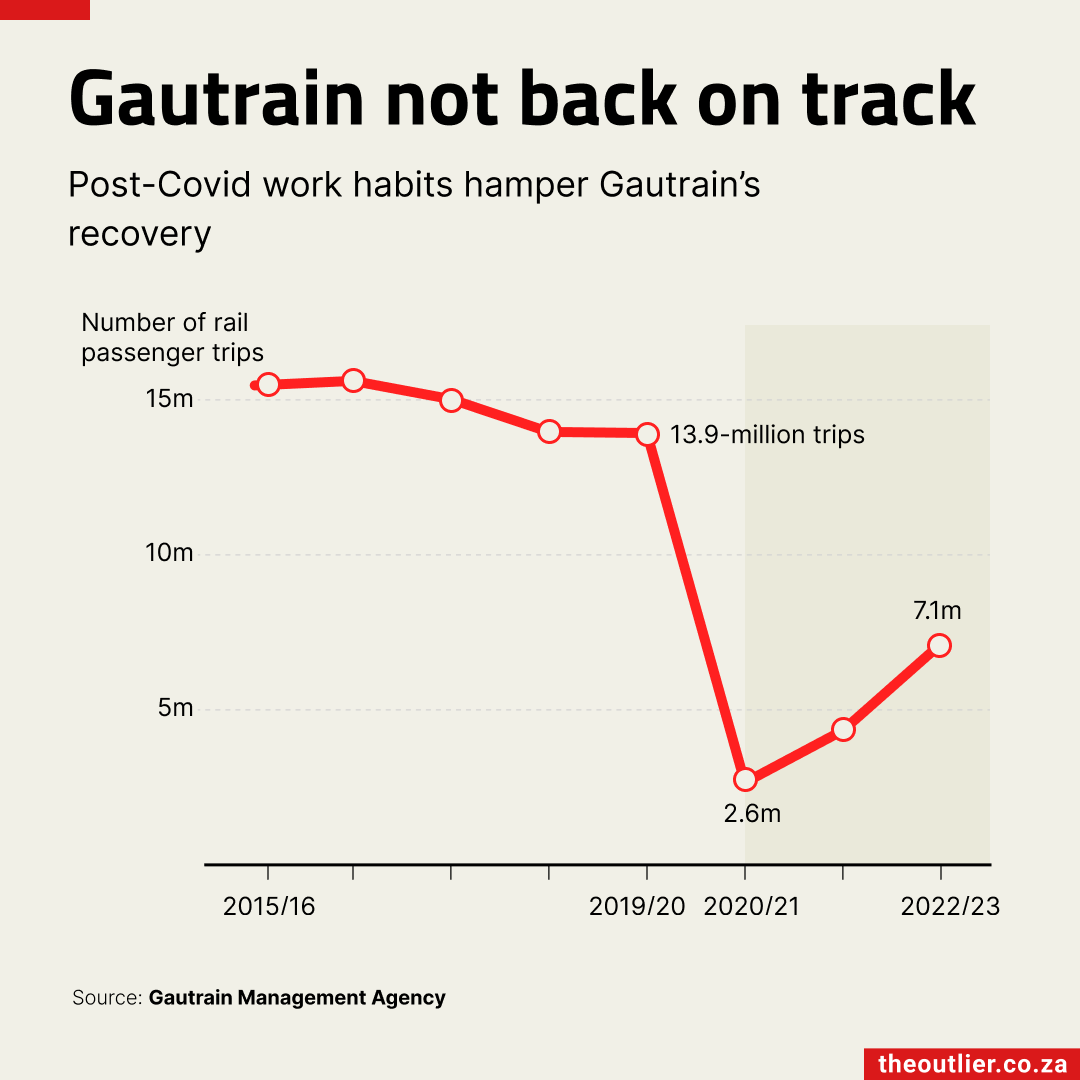
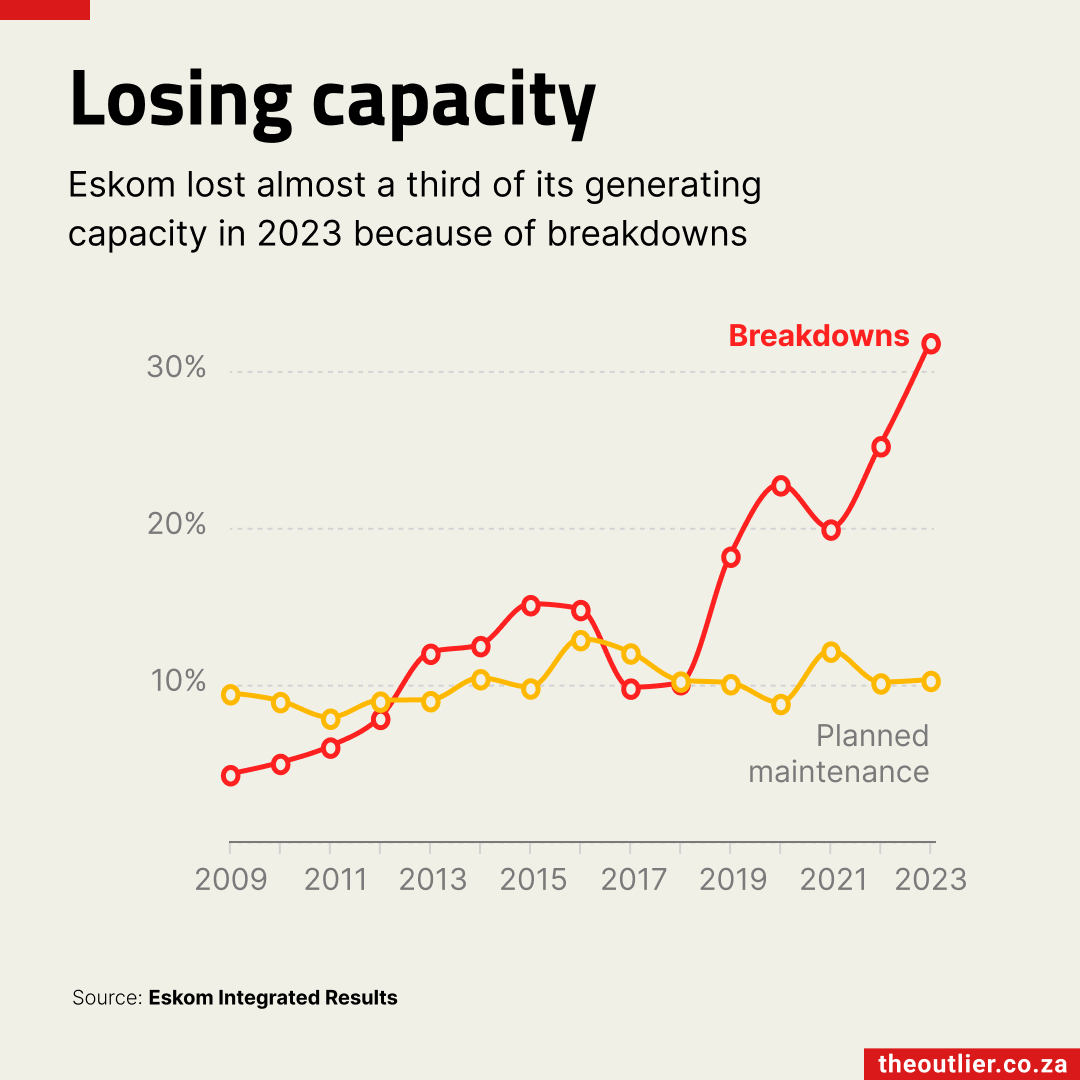
Paying for basic services such as transport and electricity can swallow up 60% of a minimum wage, leaving about R1,560 for food and other expenses.
As large numbers of properties are turned into short-term rental accommodation for visitors, housing options for local residents decrease.
Half of the world’s diamonds come from Africa, but Botswana, the continent’s top producer, didn’t own much of what it mined, until now.
Every month we take a look at the in-store prices of the same basket of goods across six major retailers – Shoprite, Checkers, Pick n Pay, Spar, Food Lover’s Market and Woolworths.
Every month we take a look at the in-store prices of the same basket of goods across six major retailers – Shoprite, Checkers, Pick n Pay, Spar, Food Lover’s Market and Woolworths.
Our basket of nine basic items will set you back R431 at Spar, which is R39 more expensive than the same goods at Woolworths. Find out more in our November update.
For two months in a row, Spar’s basket has been the most expensive option. Shoprite’s has been the most affordable since we added the retailer to the list in August.
Before 2006, businesses used to match the government’s spending on research and development in South Africa, now the government spends more.
Spar’s basket was the most expensive option this month and Shoprite’s was the cheapest. The same bag of groceries differed by R48. Find out more in our September 2022 update.
We’ve added a new retailer to our grocery basket comparison. Now, we look at the in-store prices of the same basket of goods across five retailers.
An update on our in-store survey of the same basket of basic goods at eight of South Africa’s major retailers, including, Checkers, Shoprite, Spar, Pick n Pay, Woolworths, Food Lover’s Market, Boxer Superstores and Makro.
Every month we take a look at the in-store prices of the same basket of goods across four major retailers – Checkers, Pick n Pay, Spar and Woolworths.
Here’s a look back at 12 months of collecting prices for basic goods at a selection of South Africa’s major retailers. Since we started this project in June 2022, a lot has changed.
An update on our in-store survey of the same basket of basic goods at eight of South Africa’s major retailers, including, Checkers, Shoprite, Spar, Pick n Pay, Woolworths, Food Lover’s Market, Boxer Superstores and Makro.
We have included Makro and Boxer Superstores on the list of South African retailers that make up our grocery basket survey. Now, we look at prices from eight stores in Gauteng.
For the first time in 2023, the Spar basket was not the month’s most expensive, with the Checkers basket taking the top spot. Find out more in our March update.
We’ve added a new store to our grocery basket comparison. Now, we look at the in-store prices of the same basket of goods across six major retailers.
Children up to the age of 18 years are the largest group of recipients of social grants in South Africa.
Our unemployment tracker is updated every quarter following the release of new employment data by Stats SA.
Unemployment in South Africa is among the worst in the world and unemployment among the youth is particularly high, but that doesn’t tell the full story.